Probability and Statistics
This is the fifth part of our free ASVAB Math Study Guide, covering probability and statistics. Topics include mean, median, mode, and range as well as the basics of probability. At the bottom of the page there is a 10-question review quiz to test your understanding of these probability concepts.
Mean, Median, Mode, and Range
Mean, Median, and Mode are referred to as “measures of central tendency” since they give you a feel for where the “center” or “average” value of the data typically lies.
Mean
When people say “Average” they mean “Mean”. To find the Mean, add up all the values and divide by the number of values.
Example: Find the mean of the following data values: $12, 9, 5, 10, 6, 13, 9, 8$
First find the sum of the values. $12 + 9 + 5 + 10 + 6 + 13 + 9 + 8$ $ = 72$
Next determine the number of values. There are $8$ values in our list.
$\text{Mean} = \dfrac{\text{Sum of Values}}{\text{Number of Values}}$ $ = \dfrac{72}{8} = 9$
Median
The “Middle” value when the list of values is arranged from smallest to largest. When there are two middle values, you find the mean of these two values to determine the Median.
Example: Find the median of the following data values: $13, 11, 2, 13, 3, 14, 7, 5$
First arrange the list from smallest to largest. $2, 3, 5, 7, 11, 13, 13, 14$
Next find the middle value. Since there are eight values in our list, there are two “middle” values, $7$ and $11$. The Median is the mean of these two values.
$\text{Median}= \dfrac{7 + 11}{2} = 9$
Mode
The “Most Common” (notice that “Mode” and “Most” start with the same two letters) value that occurs in a list of data.
Example: Find the mode of the following data values: $12, 9, 5, 10, 6, 13, 9, 8$
Here we simply need to determine which value occurs the most often. Since the value $9$ occurs twice in the list and all other values each only occur once, the $\text{Mode}= 9$.
Range
The largest value minus the smallest value.
Example: Find the range of the following data values: $13, 11, 2, 13, 3, 15, 7, 6$
The largest value is $15$. The smallest value is $2$.
$\text{Range} $ $ = \text{Largest Value} − \text{Smallest Value}$
$\text{Range} = 15 − 2 = 13$
Outliers
Values that are very low or high relative to the other values in a list of values. If you have many houses in a neighborhood in the \$250K–300K range and then one mansion that is valued at \$3M, we would call the value of the mansion an “outlier” in our set of data.
The methods for determining whether or not a value is truly an outlier are beyond the scope of this guide, but we wanted you to at least be familiar with the term.
Probability Basics
Probability refers to the likelihood of an event or combination of events occurring.
Probabilities can fall anywhere from 0 to 1. 0 means the event will never occur. 1 means the event will always occur. A probability between 0 and 1 means the event will sometimes occur; the higher the value, the greater the likelihood of the event.
Probabilities are often expressed as a percentage (%) in which case they will range from 0% to 100%.
Probability Formula
$\text{Probability of an event}$ $ = \dfrac{\text{Number of Successful Outcomes}}{\text{Number of Possible Outcomes}}$
You might think of “Number of Successful Outcomes” as the number of ways you can win the game and “Number of Possible Outcomes” as all the different ways the game might turn out.
Example: The names of each of the states are written on ping pong balls and put in a bag. What is the probability of drawing a state with a name that begins with the letter “O”?
The Number of Successful Outcomes is the number of states with a name that starts with “O”. It turns out there are three: Ohio, Oklahoma, and Oregon.
Number of Successful Outcomes $= 3$
The Number of Possible Outcomes is the number of states we could possibly choose. There are 50 states.
Number of Possible Outcomes $= 50$
$\text{Probability that an ‘O’ state is chosen}$
$ = \dfrac{\text{Number of Successful Outcomes}}{\text{Number of Possible Outcomes}}$
$= \dfrac{3}{50} = 0.06 = 6\%$
The likelihood of this event occurring can be described as $3 \text{ out of }50$, $3/50$, $0.06$, or $6\%$.
Tree Diagrams
A tree diagram is a useful way to visualize more complex probability problems.
Consider a game where you first flip a coin and then roll a die. How might we determine the probability of first flipping “heads” then rolling either a $5$ or $6$?
$\text{Probability of an event}$ $ = \dfrac{\text{Number of Successful Outcomes}}{\text{Number of
Possible Outcomes}}$
We need some way to figure out the number of successful outcomes and the number of possible outcomes. A tree diagram helps us do this.
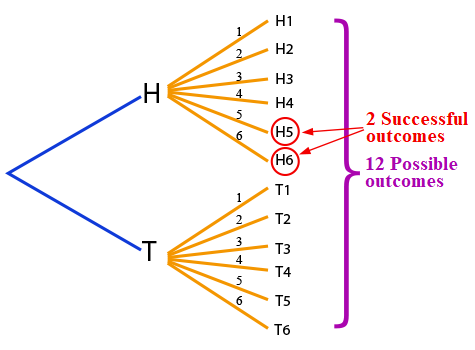
The first branch of the tree shows H (heads) and T (tails). Then for each of these branches there are 6 possible rolls of the die that could occur (1 through 6).
There are 12 possible outcomes in all: H1, H2, H3, H4, H5, H6, T1, T2, T3, T4, T5, T6 (where “T5” = flip “tails”, roll a 5)
There are only 2 successful outcomes where we first flip a “heads” then roll either a 5 or 6.
$\text{Probability of ‘heads’ then ‘5 or 6’}$
$ = \dfrac{\text{Number of Successful Outcomes}}{\text{Number of Possible Outcomes}}$
$= \dfrac{2}{12} = \dfrac{1}{6}$
Thus, the probability of flipping a “heads” then rolling either a 5 or 6 is 1/6.
Independent Events
The above question involving the flipping of a coin followed by the rolling of a die can also be solved using a very useful property of probability.
If two (or more) events are independent, meaning the result of one event in no way alters the result of another event, we can use the following formula:
Probability of Two Independent Events = Probability of 1st Event × Probability of 2nd Event
Let’s again consider the example above where we flip a coin and roll a die. What is the probability of first flipping “heads” then rolling either a 5 or 6?
Probability of flipping ‘heads’ $= \dfrac{\text{Number of Successful Outcomes}}{\text{Number of Possible Outcomes}}$ $= \dfrac{1}{2}$
Probability of rolling ‘5 or 6’ $= \dfrac{\text{Number of Successful Outcomes}}{\text{Number of Possible Outcomes}}$ $= \dfrac{2}{6}$
Whether we flip ‘heads’ or ‘tails’ on the coin will in no way influence the outcome of rolling the die. Thus, they are independent events, which means we can use the independent events probability formula.
Probability of Two Independent Events = Probability of 1st Event × Probability of 2nd Event
Probability of ‘heads’ then ‘5 or 6’ = Probability of ‘heads’ × Probability of ‘5 or 6’
Probability of ‘heads’ then ‘5 or 6’ $= \dfrac{1}{2} × \dfrac{2}{6}$ $= \dfrac{2}{12} = \dfrac{1}{6}$
We have a 1 in 6 chance of first flipping ‘heads’ and then rolling ‘5 or 6’ – this is the exact same result we determined with the help of the tree diagram.
Now that you’ve read more of our lessons and tips for the Mathematics section of the ASVAB, put your skills to practice with the review quiz below. Try not to reference the above information and treat the questions like a real test.
Part 5 Review Quiz:
Congratulations - you have completed .
You scored %%SCORE%% out of %%TOTAL%%.
Your performance has been rated as %%RATING%%
Question 1 |
What is the mode of the following data?
$12, 8, 3, 3, 18, 15, 12, 15, 9, 10, 15$
$3$ | |
$15$ | |
$18$ | |
No mode |
Question 2 |
What is the median of the following data?
$12, 8, 3, 3, 18, 15, 12, 15, 9, 10, 15$
$12$ | |
$15$ | |
$10$ | |
No median |
$3, 3, 8, 9, 10, \underline{12}, 12, 15, 15, 15, 18$
Either use a finger to cover up numbers on each side, working your way in, or mentally find the middle number that has the same amount of numbers on each side. $12$ is in the exact middle, with $5$ numbers to the left of it and $5$ numbers to the right.
Question 3 |
What is the mean of the following data?
$3, 3, 14, 9, 10, 12, 15, 12, 15, 15, 18, 18$
$144$ | |
$15$ | |
$18$ | |
$12$ |
$3 + 3 + 14 + 9 + 10$
$+ 12 + 15 + 12 + 15$
$+ 15 + 18 + 18 = 144$
Next, divide the sum by the amount numbers there are. There are $12$ numbers in the original set.
$144 ÷ 12 = 12$
The mean is $12$.
Question 4 |
What is the range of the following data?
$3, 3, 14, 9, 10, 12, 15, 12, 15, 15, 18, 18$
$3$ | |
$12$ | |
$15$ | |
$18$ |
$18 − 3 = 15$
Question 5 |
There are 3 red t-shirts, 5 gray t-shirts, and 1 blue t-shirt in a clothing drawer. What are the odds of grabbing a red t-shirt if you pick at random?
$3$ | |
$\dfrac{1}{3}$ | |
$\dfrac{1}{2}$ | |
$1$ out of $9$ |
Question 6 |
In a bag are $20$ chips that are numbered $1$ through $20$. What are the odds of drawing a $\#3$ or a $\#7$ chip?
$.1$ | |
$10$ | |
$\dfrac{1}{20}$ | |
$1$ out of $40$ |
Question 7 |
You have a coin and a die. What are the odds of flipping a coin and landing on tails, and then rolling the die and getting a $1$?
$\dfrac{1}{2}$ | |
$\dfrac{1}{12}$ | |
$\dfrac{1}{8}$ | |
$\dfrac{2}{12}$ |
$\dfrac{1}{2} × \dfrac{1}{6} = \dfrac{1}{12}$
Question 8 |
What are the odds of flipping a coin three times and landing on heads every time?
$\dfrac{1}{2}$ | |
$\dfrac{1}{6}$ | |
$\dfrac{1}{8}$ | |
$\dfrac{3}{16}$ |
Question 9 |
There are $3$ green marbles and $4$ black marbles in a bag. You pull out one marble, set it down, and then reach in and grab a second. What are the odds you draw a black marble both times?
$\dfrac{16}{49}$ | |
$\dfrac{4}{7}$ | |
$\dfrac{2}{7}$ | |
$\dfrac{12}{49}$ |
First, calculate the probability of pulling out a black marble on the first draw. There are $4$ black marbles and $7$ total marbles, so the probability is $\frac{4}{7}$.
The probability for pulling out a second black marble is different, since we've removed one marble. There are now $3$ black marbles and $6$ total marbles, making the probability $\frac{3}{6}$, or $\frac{1}{2}$ when simplified.
Finish the problem by multiplying the fractions together to get the probability of both events occurring.
$\dfrac{4}{7} × \dfrac{1}{2} = \dfrac{4}{14}$, which can be simplified to $\dfrac{2}{7}$.
Question 10 |
There are $4$ purple marbles, $5$ pink marbles and $4$ blue marbles in a bag. You pull out one marble, set it down, and then reach in and grab a second. What are the odds you draw a purple marble and then a pink marble?
$\dfrac{5}{39}$ | |
$\dfrac{20}{169}$ | |
$\dfrac{16}{156}$ | |
$\dfrac{9}{25}$ |
There are $4$ purple marbles and $13$ total marbles to start. Thus, drawing a purple marble first has a probability of $\frac{4}{13}$.
After a purple marble is removed, there are still $5$ pink marbles, but the total number of marbles is now $12$. Thus, the probability of drawing a pink marble is $\frac{5}{12}$.
Finish the problem by multiplying these two fractions together.
$\dfrac{4}{13} × \dfrac{5}{12} = \dfrac{20}{156}$, which can be simplified to $\dfrac{5}{39}$.
Question 11 |
Find the median of the following data:
$12, 8, 3, 15, 13, 6, 9, 1$
$9.5$ | |
$8.5$ | |
$14$ | |
$8$ |
$1, 3, 6, 8, 9, 12, 13, 15$
Next we determine the middle number in our ordered list. Since there is an even number of elements in our list, there are two middle numbers.
$1, 3, 6,$ 8, 9, $12, 13, 15$
When we have two middle numbers, the median will be the mean (average) of these two numbers.
Median = mean of $8$ and $9$ $= \dfrac{8 + 9}{2} = 8.5$
|
List |